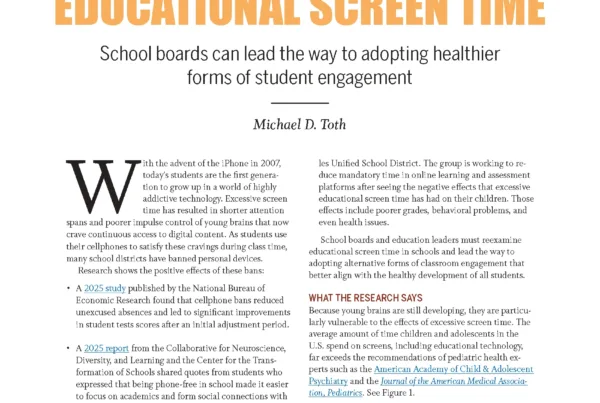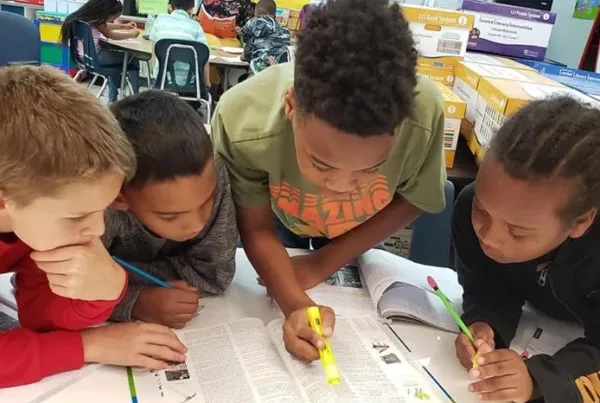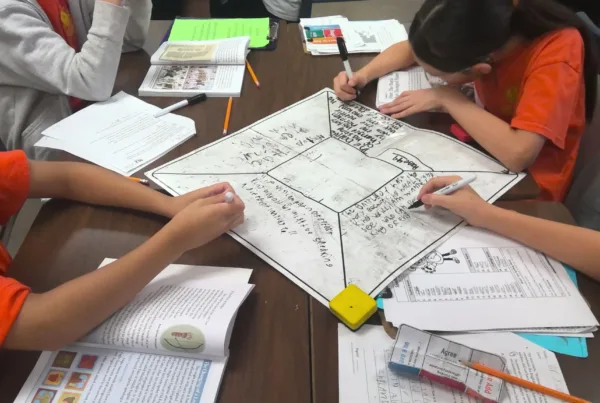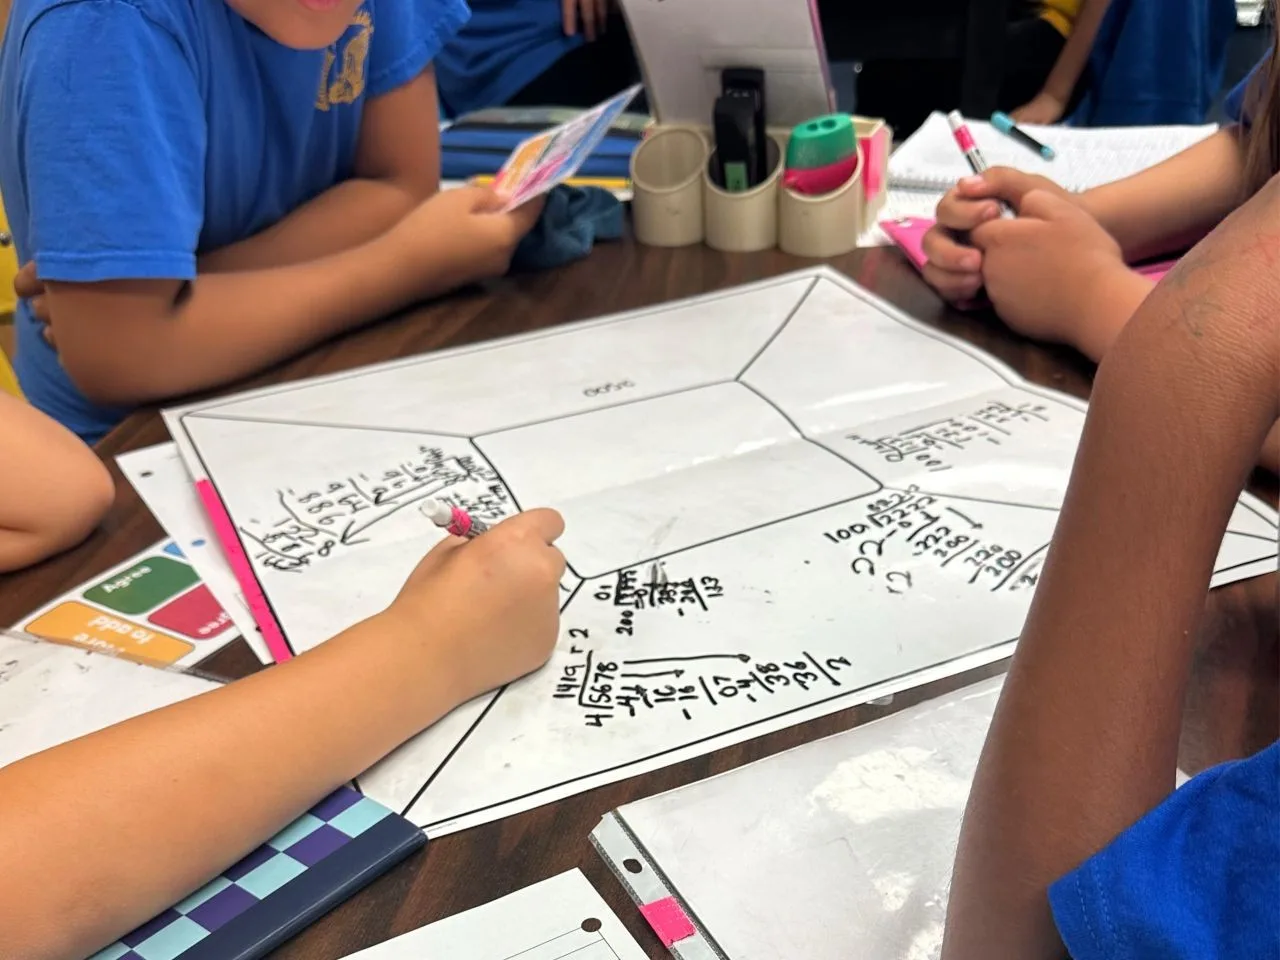
Students at Bullhead City School District #15, Arizona, engage in rigorous, team-based learning. Bullhead City adopted the RigorWalk tool and is one of the districts included in this study.
March 2026
Executive Summary
In a study of 82 schools, higher RigorWalk® scores were a significant predictor of proficiency point gains, translating to approximately 4–6 percentage point increases in ELA and math school proficiency within one year, even after controlling for school demographics.
Study Overview
RigorWalk is a non-evaluative classroom walkthrough tool designed to measure instructional rigor, identify schoolwide trends in teaching practice, and ultimately predict student achievement. Education leaders use RigorWalk data to assess the quality of Tier 1 classroom instruction, including reports that pinpoint areas to improve student learning.
Between July 2022 and February 2026, 884 schools conducted over 250,000 classroom walkthroughs using RigorWalk.
This study focuses on a subset of 82 schools with complete instructional, demographic, and school achievement data to examine whether RigorWalk scores are associated with student performance outcomes.
Why This Study Matters
Historically, decision-making in education has narrowly focused on assessment data and has not collected information that would help educators identify systems issues, pinpoint gaps, and develop students to their fullest potential (Dodman et al., 2023; Isaacs, 2021; Mandinach & Schildkamp, 2021; Marsh et al., 2006).
In fact, low levels of rigorous student work are often far more pervasive than leaders anticipate. The Turnaround Trap report shared an analysis of 39 turnaround schools in five states, finding that 85% of classrooms showed minimal evidence of rigor (Toth et al., 2025).
School leaders need better tools for data-driven decision-making to improve the quality of instruction and accelerate learning for all students (Hamilton et al., 2009; Mandinach & Schildkamp, 2021; Marsh et al., 2006).
This study aims to strengthen the evidence base around the measurement of academic rigor, the association between rigor and student achievement, and the utility of RigorWalk as a tool that provides leaders with a reliable and timely data source.
Previous Research Validation of RigorWalk
The Applied Research Center has previously studied the connection between non-evaluative instructional walks and student achievement. A peer-reviewed study found that schools where leaders conducted more RigorWalks demonstrated significantly higher achievement in both ELA and math (Basileo et al., 2024).
RigorWalk was developed from the Rigor Appraisal instrument, which is scientifically correlated with both benchmark and state assessment learning gains. The same peer-reviewed research study found that higher scores on the Rigor Appraisal had a statistically significant correlation to:
- Higher ELA rates
- Higher math learning rates
- Higher student attendance
- Lower behavior referrals
- Lower suspension rates
How Does RigorWalk Work?
During RigorWalks, school or district leaders conduct brief, focused classroom visits, typically under 10 minutes each, across 5 to 10 classrooms. Leaders capture real-time data using a clearly defined rubric based on what they observe. Each item on the rubric includes “look-fors,” which are examples of student evidence.
RigorWalk measures instructional rigor through evidence in three areas:
- Standards-Based Student Evidence: Are students demonstrating mastery of the standards?
- Organizing Students to Achieve the Standard: To what extent are students working in purposeful teams to take ownership of their learning and achieve the standard?
- Monitoring to Take Action Within a Lesson: To what degree are students receiving timely support and feedback that allows them to adjust and move forward in their learning?
RigorWalk is not a teacher evaluation. RigorWalk reports are designed to identify trend data that can guide next steps for coaching and professional development schoolwide. Leaders often use RigorWalk on a weekly basis to gain a real-time snapshot of the quality of instruction across the school without needing to wait for benchmark or end-of-year test results.
Subscribe for curated education insights delivered every two weeks.
Study Design
The Applied Research Center analyzed data from 82 schools that use RigorWalk and had complete demographic and school achievement data available. The following section provides an overview of the study sample, the data sources and measures, and the methods used.
Sample Studied
Schools: 82
States: 9
Districts: 12
- Bullhead City School District #15, Arizona
- Kayenta Unified School District #27, Arizona
- Red Mesa Unified School District #27, Arizona
- Colorado Springs Schools District 11, Colorado
- Hillsborough County Public Schools, Florida
- Martin County School District, Florida
- School District U-46, Illinois
- South Bend Community School Corporation, Indiana
- Northwest Local School District, Ohio
- Oklahoma City Public School, Oklahoma
- Midland ISD, Texas
- Wyoming County BOE, West Virginia

Data Sources and Measures
This study utilized two main data sources: school proficiency results and records of classroom walkthroughs.
School Achievement Data
- Student performance was measured using the end-of-year state assessment data from school year 2023-2024.
Classroom Walkthrough Data
- RigorWalk classroom walkthrough data was tracked through Instructional Empowerment’s platform for the same time period and looked at the change from the first to last RigorWalk score
How the Analysis Was Conducted
Structural equation modeling was used to test whether schools with higher RigorWalk scores also had higher school proficiency gains. Advanced statistical analysis showed that RigorWalk is a reliable and consistent measure of instructional rigor.
The analysis controlled for key differences in student populations to ensure a fair comparison, including:
- Socioeconomic status
- English-learner status
Controlling for these factors helps isolate the relationship between RigorWalk scores and school achievement, ensuring that results reflect differences associated with implementation rather than differences in the types of students served.
Calculating the Results
The results were first estimated as effect sizes derived from the standardized beta coefficients in the final model, where the predictor was the RigorWalk change score and school context variables were controlled. These effect sizes represent the strength of the relationship between changes in RigorWalk scores and student outcomes.
To make the findings more meaningful for practitioners, we translated the effect sizes into percentile gains to show how much performance improved relative to other schools. We then converted those gains into changes in proficiency rates by applying the effect size to the typical variation in scores (the standard deviation), allowing us to estimate real-world improvements in school proficiency outcomes.
Key Findings
Increases in RigorWalk Scores Are Associated with Higher Student Proficiency
Schools with stronger gains in instructional rigor, as measured by RigorWalk, showed significantly higher student proficiency in both ELA and math, even after accounting for student demographics—and within a single school year.
In ELA, stronger instructional rigor was associated with:
- Approximately 14 percentile points higher performance, or
- A 4–5 percentage point increase in ELA proficiency rates
In math, stronger instructional rigor was associated with:
- Approximately 16 percentile points higher performance, or
- A 5–6 percentage point increase in math proficiency rates
These results suggest that improvements in instructional rigor are meaningfully associated with gains in achievement.

Federal Evidence Designation
The results of this study meet ESSA Tier 3 (Promising Evidence) criteria, qualifying RigorWalk as an evidence-based practice under federal guidelines.
A Principal’s Perspective on the Positive Impact of RigorWalk
Aaron Ford is the principal of Audubon Elementary School in Colorado Springs School District 11, Colorado. Audubon is one of the schools included in this study.
Ford highlighted several positive impacts his school experienced after adopting RigorWalk:
- Visible indicators of instructional rigor: “It’s helped me so much as an instructional leader, to be able to identify the key components that we should be seeing in the classroom, the best practices that we should be seeing, and to give something very clear cut of what I’m seeing and not seeing.”
- Clear and actionable guidance for teachers: “Now when we walk in, we hear teachers ask, ‘How do I get to knowledge utilization today?’ Those are the questions that they’re asking because they have something that they can clearly use as a tool to say, ‘Here’s where I want to get and here’s what it means for our kids.’”
- Accountability for systemwide success: “When we were in classrooms 40 times per year three years ago, to now being in classrooms 150 to 200 times per year or more, it makes a huge difference. It’s a tool that helps guide me, but it also helps the accountability to the whole system of saying we’re going to continue to have high expectations for ourselves because that’s what kids need.”
What These Findings Mean for Education Leaders
1. Instructional rigor can be clearly and consistently measured.
RigorWalk captures observable evidence of instructional rigor across classrooms, giving leaders a reliable way to identify schoolwide patterns in teaching practice and focus improvement efforts strategically.
2. Instructional rigor is meaningfully connected to student achievement.
Higher RigorWalk scores were associated with measurable gains in ELA and math proficiency—even after accounting for school demographics. That means strengthening daily classroom rigor is linked to improved outcomes.
3. Leaders can act on instructional data before end-of-year results arrive.
Rather than waiting for benchmark or state assessment data, leaders can use real-time walkthrough insights to adjust coaching, professional development, and instructional priorities throughout the year.
4. Instructional walks can function as a strategic improvement tool—not just a monitoring activity.
RigorWalk data reports help leadership teams align instructional focus, build capacity, and concentrate effort where it will have the greatest impact.
The findings suggest that improving instructional rigor is not an abstract goal but a measurable, strategic pathway linked to student achievement. One of the most powerful actions that leaders can take for their students is monitoring and strengthening instructional rigor throughout the year.
References
Basileo, L., Toth, M., and Hyunjin C. (2026). RigorWalk Your Way to Achievement: How Non-Evaluative Instructional Walks Predict Gains in Student Proficiency. In Progress.
Basileo, L. D., Lyons, M. E., & Toth, M. D. (2024). Leading Indicators of Academic Achievement: Investigating the Predictive Validity of an Observation Instrument in a Large District. Sage Open, 14(2). https://doi.org/10.1177/21582440241261119
Dodman, S. L., DeMulder, E. K., View, J. L., Stribling, S. M., & Brusseau, R. (2023). ‘‘I knew it was a problem before, but did I really?’’: Engaging teachers in data use for equity. Journal of Educational Change, 24(4), 995–1023. https://doi.org/10.1007/s10833-022-09477-z
Hamilton, L. S., Stecher, B. M., & Yuan, K. (2009). Standards-based reform in the United States: History, research, and future directions. www.rand.org/pubs/reprints/RP1384.html
Isaacs, J. (2021). The problem with data-driven decision making in education. Journal of Educational Thought, 54(1), 77–98.
Mandinach, E. B., & Schildkamp, K. (2021). Misconceptions about data-based decision making in education: An exploration of the literature. Studies in Educational Evaluation, 69, 100842. https://doi.org/10.1016/j.stueduc.2020.100842
Marsh, J. A., Pane, J. F., & Hamilton, L. S. (2006). Making sense of data-driven decision making in education: Evidence from recent RAND research. https://doi.org/10.7249/OP170
Toth, M. D., Fitzgerald, M., & Lyons, M. (2025). The turnaround trap: Why quick fixes fail students. Instructional Empowerment. https://instructionalempowerment.com/library/the-turnaround-trap/
Subscribe for curated education insights delivered every two weeks.
About Instructional Empowerment
Our mission is to end generational poverty and eliminate achievement gaps through redesigned rigorous Tier 1 Instruction that ensures deeper learning for ALL students.