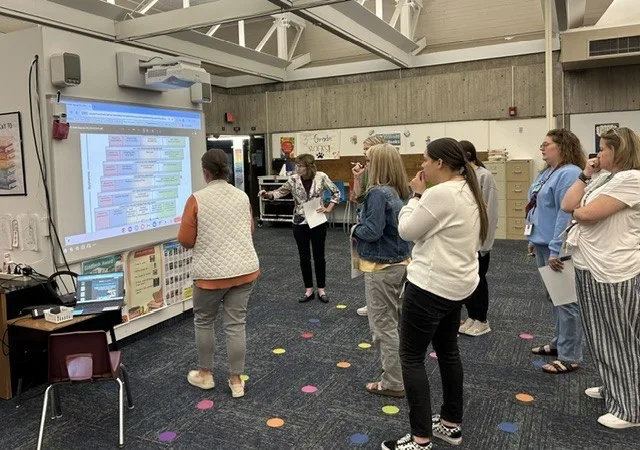
Leaders use the SIMM framework to debrief Rigor Appraisal data at Nixon Elementary School in Cedar Rapids Community School District, Iowa. This process is an example of a best practice for ensuring quality data in comprehensive needs assessments.
July 2026
Topics Covered
Quality data in comprehensive needs assessments is externally validated, predictive of student outcomes, and organized into a framework leaders can act on. A school comprehensive needs assessment—the structured process a district uses to identify where student outcomes are falling short and why—is only as effective as the data behind it, and the quality of that data determines the quality of the school improvement plan it produces.
Key Takeaways
- Quality data tracks leading indicators (real-time classroom conditions), not just lagging indicators (test scores that arrive after the fact).
- Peer-reviewed measures like the Rigor Appraisal® are validated to predict student outcomes; self-reported data rarely is.
- A framework such as the SIMM organizes findings across six instructional pillars, turning data into a prioritized improvement plan.
What Rigorous Data Measurement Reveals
In a study of 383 classrooms across 39 turnaround schools in Florida, Texas, Arizona, Indiana, and Iowa, Instructional Empowerment’s Applied Research Center found that 85% of observed classrooms either showed no evidence of student work or were operating at the lowest level of academic rigor (Toth, Fitzgerald, & Lyons, 2025).

Source: Toth, Fitzgerald, & Lyons (2025), The Turnaround Trap.
Even with school improvement plans in place and leaders actively working on the problems, a gap persisted between the plan and the instructional reality. In many cases, that gap went unmeasured for years as schools cycled in and out of state accountability.
This pattern isn’t unique to schools in turnaround status. Without tools that measure the actual cognitive level of student work across the school, the data in a comprehensive needs assessment can miss the gaps and the highest-leverage areas for action.
Types of Data in Comprehensive Needs Assessments: Leading vs. Lagging Indicators
Most school improvement efforts rely on lagging indicators, such as state test scores and interim benchmarks, which identify problems only after they have grown large enough to appear in outcomes. By that point, the instructional gaps driving those outcomes have often been in place for years, and the root causes of those gaps often go unmeasured.
Research shows that leaders recognize the need for timely metrics (Torres, 2024). And yet, most schools lack access to leading indicators—metrics that show what is happening in schools in real time and predict outcomes before they happen.
In fact, Instructional Empowerment’s Applied Research Center found no existing studies of districts using leading indicators to guide school improvement efforts. Without tools that provide actionable, real-time instructional data, improvement plans are typically built from student outcomes after the fact, not from insight into the instructional conditions that created the outcomes.
Why Research-Validated Data Makes a Difference
The study referenced above used anonymized findings from Instructional Empowerment’s School Comprehensive Needs Assessment, which centers on data from the Rigor Appraisal®, a non-evaluative schoolwide observational assessment of instructional quality conducted by certified third-party scorers.
Because the Rigor Appraisal is externally conducted rather than self-reported, its data can uncover patterns that internally administered processes may not surface. Most importantly, the data from the Rigor Appraisal is validated to predict student outcomes—a level of research validation rarely found among needs assessment processes. This means leaders can use the Rigor Appraisal to measure progress of school improvement efforts throughout the school year and make timely adjustments, knowing that the Rigor Appraisal data will align with end-of-year outcomes.
In a peer-reviewed study of 53 schools published in SAGE Open (2024), higher Rigor Appraisal scores were significantly correlated with:
- Higher ELA and math achievement
- Higher attendance rates
- Lower discipline referrals and suspensions
- Stronger school climate
This peer-reviewed study was conducted by Lindsey Devers Basileo, Ph.D., a U.S. Department of Education What Works Clearinghouse certified reviewer. The Rigor Appraisal meets Tier 3 (Promising Evidence) criteria under the Every Student Succeeds Act.
Subscribe for curated education insights delivered every two weeks.
A Framework for Interpreting What the Data Shows
Rigorous measurement tools are one aspect of what makes a needs assessment actionable. Another important aspect is the framework used to interpret and organize findings.
Instructional Empowerment’s School Comprehensive Needs Assessment aligns with the School Instructional Maturity Model™ (SIMM)—a research-validated framework built around six interconnected instructional pillars.
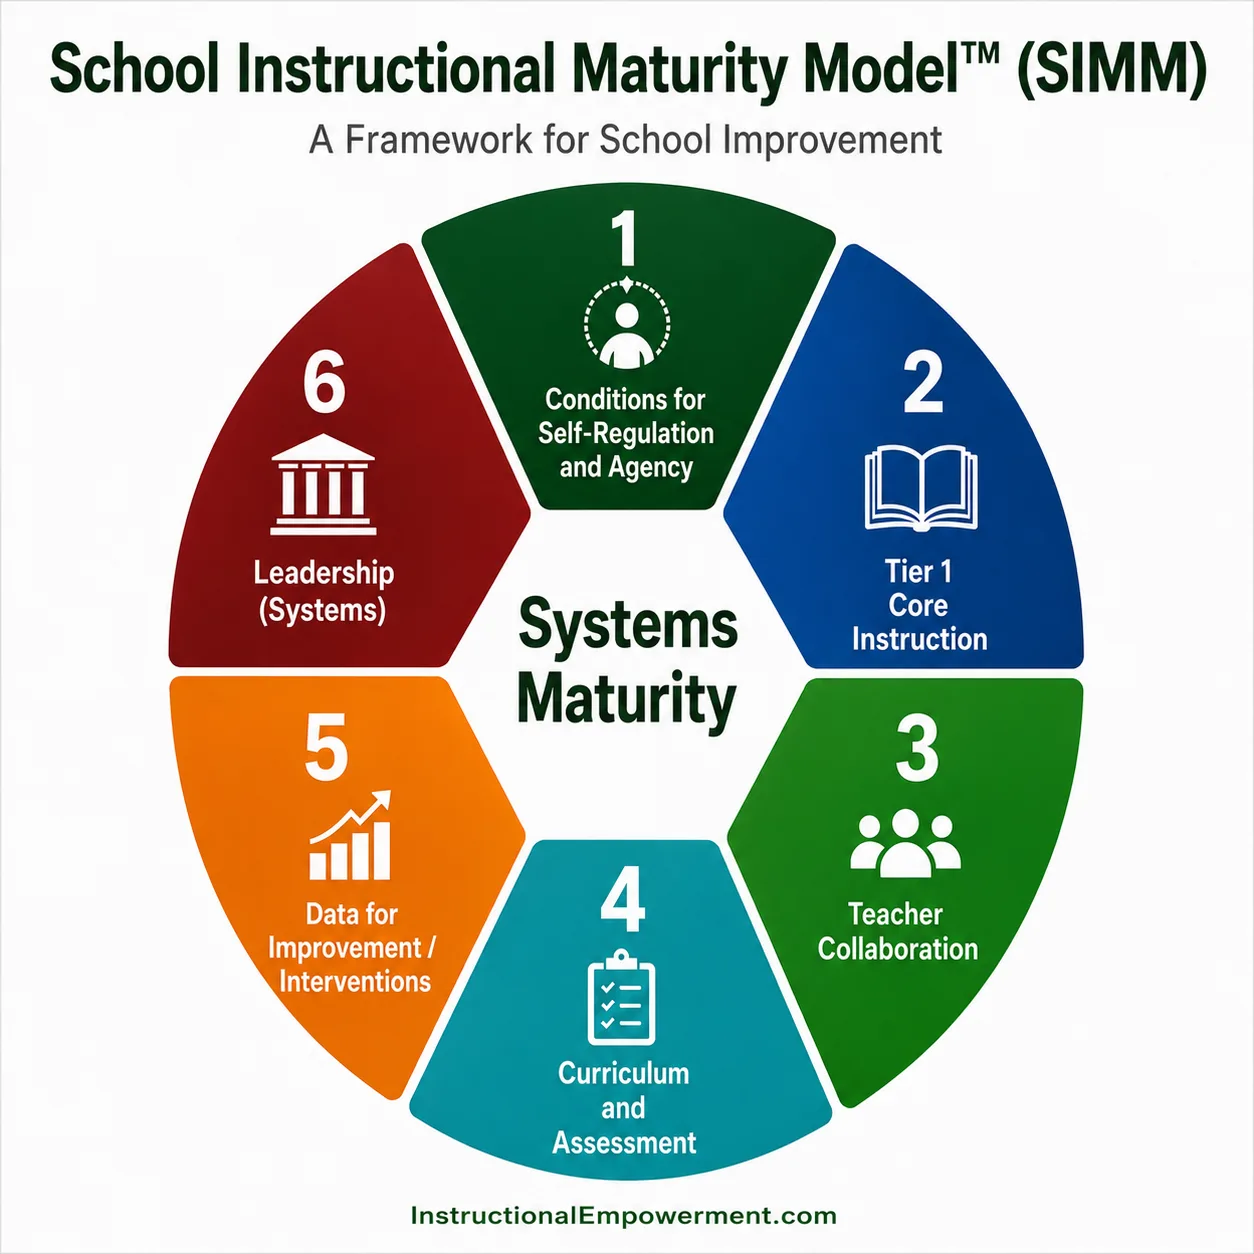
Rather than surfacing isolated data points, the SIMM gives leaders a clear path toward the next level of performance. The six pillars are designed to uncover complex school improvement challenges through a systems-based lens.
For example, low rigor in classrooms connects to the clarity of the instructional model, the effectiveness of leadership practices, the alignment of professional development, and the coherence of school culture. The SIMM is designed to show how those dimensions interact, translating the data from a comprehensive needs assessment into an improvement plan for results that last.
From Data to an Actionable Plan
In summary, the quality of a school improvement plan is determined by the quality of the data used to build it. A needs assessment process is most effective for improvement planning when it:
- Measures leading indicators instead of only lagging indicators
- Uses peer-reviewed measurement tools administered by qualified external reviewers
- Organizes data into a research-validated framework for interpretation
Instructional Empowerment’s School Comprehensive Needs Assessment was built around these three criteria, producing improvement plans grounded in root causes.
Connect with an Expert
For district and school leaders who want to understand what a rigorous School Comprehensive Needs Assessment process looks like in practice, Stephanie Terrell, Ed.S., Executive Director of School Transformation, brings more than 30 years of experience as a principal, instructional leader, and teacher. She has supported school improvement efforts nationwide.
Frequently Asked Questions
Research-validated data comes from measurement tools whose scores have been statistically shown to predict student outcomes. The Rigor Appraisal®, for example, was validated in a peer-reviewed SAGE Open (2024) study, where higher scores correlated with stronger achievement and attendance, fewer discipline referrals, and a stronger school climate.
Lagging indicators are outcome measures, such as state test scores and interim benchmarks, that reveal problems only after they appear in results. Leading indicators are real-time measures of classroom conditions, like the academic rigor of student work, that predict those outcomes before the end of the year.
Research on school improvement best practices has long recommended recruiting external evaluators to conduct needs assessments because internal processes introduce bias that is difficult to control for (Hanover Research, 2014). External, third-party scoring is often much more objective. It produces consistent, comparable data and can surface patterns that self-reported or internally administered processes may not reach.
Critically, it also allows results to be validated against student outcomes, a relationship that is difficult to establish when the same system conducting the assessment is also responsible for the outcomes it measures.
A framework organizes individual findings and outlines the next steps for improvement. The School Instructional Maturity Model™ (SIMM) maps results across six instructional pillars, showing how factors like classroom rigor, leadership, and professional development interact so leaders can prioritize the most meaningful improvements.
References
Basileo, L. D., Lyons, M. E., & Toth, M. D. (2024). Leading indicators of academic achievement: Investigating the predictive validity of an observation instrument in a large district. SAGE Open, 14(2). https://doi.org/10.1177/21582440241261119
Hanover Research. (2014). Best practices for school improvement planning. https://www.hanoverresearch.com/media/Best-Practices-for-School-Improvement-Planning.pdf
Torres, A. C., Frost Waldron, S., & Burns, J. (2024). Compliance, chaos, or coherence? How superintendents, districts, and schools draft coherence from school turnaround policy. Educational Evaluation and Policy Analysis, 46(1), 133–159. https://doi.org/10.3102/01623737231161363
Toth, M. D., Fitzgerald, M., & Lyons, M. (2025). The turnaround trap: Why quick fixes fail students. Instructional Empowerment. https://instructionalempowerment.com/library/the-turnaround-trap/
Rigor Appraisal® is a registered trademark of Instructional Empowerment and is research-validated.