Summary dashboards
See progress from the classroom to the whole district
Growth Insights brings your data together in summary dashboards you can view by school, level, grade, or subject and export to CSV. Every dashboard is designed to answer a leadership question.
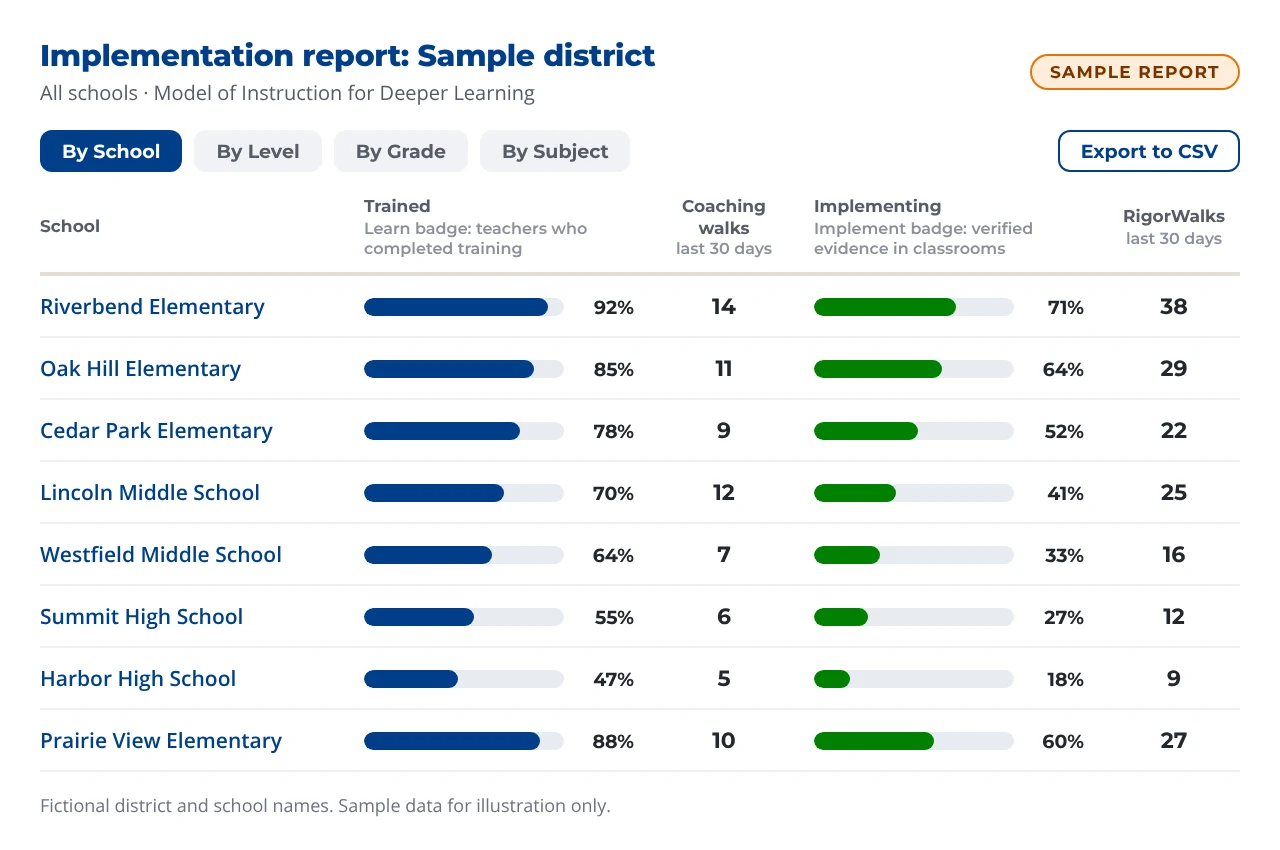
Implementation Report
Are teachers completing the learning and implementing it in classrooms?
Track Learn Badge and Verification Badge progress by school, level, grade, or subject, along with recent coaching walks and RigorWalks.
System Walks Report
Which instructional practices are improving, and where do we need to focus support?
View aggregate walk data for your organization, including RigorWalk® and Rigor Appraisal® data and other walks you add.
Pacing Report
Are teachers progressing through the instructional practices at the pace we expected?
Follow each teacher’s progress through the eight Desired Effects of the Model of Instruction for Deeper Learning®, with coaching walk counts and Verification Badge status.
Progress Report
What should coaches and leaders focus on next?
Choose a coaching walk and see which Desired Effects each teacher met, and the level of rigor, from retrieval and comprehension to analysis and knowledge utilization.
Feedback Report
Is coaching happening consistently, and is feedback reaching teachers?
See who is conducting and receiving coaching walk feedback, along with the results.
Badge Report
Which teachers, teams, or schools need additional implementation support?
Stay informed on badge progress, completion, and concerns across your district and schools.
Course Report
Are educators engaging with professional learning opportunities?
Track overall course progress across the courses available in your district.
Learning Standard Dashboard
Are students making progress toward the learning targets and standards we expect?
See class by class how students are progressing toward learning targets and standards, using evidence students upload and teachers verify in Learner Growth.